
Support for a language is dependant on the popularity of that language. But how do you measure popularity? Is it the most liked, must used simply most discussed? If Hitler may be the most discussed person from world war II, then consider that by some measures, that would make Hitler the most popular?
- What is Popularity?
- Does Popularity really matter?
- Methods, Traps & metric reliability
- Measuring by Mention
- Measure by Commit
- Measure by Questions Asked
- Measure by Votes
What is Popularity?
Many questions have more than one answer. Is the tallest mountain Everest, Mauna Kea, or Chimborazo? The answer depends on exactly how you define ‘tallest’.
The same with popularity, is it:
- the most liked language
- the language most often mentioned on web pages
- the language with the most lines of code in use (even in code written long ago)
- the language with the most lines of code being written each year now
- the language with the most programs being written each year now
- the language people most often post online questions about
It turns out, not only do many of these questions have a different answer, but each also has difficult in being measured. In the end exact ranking will be open to debate, but trends of increase or decrease are easier to establish, as it ‘very popular’ vs ‘rarely used’.
Does Popularity really Matter?
Not just languages, but every component of a system relies on someone providing and maintaining that component. It is not just about feeling vindicated with our choices, the existance of a support community if e
Frameworks, packages, IDEs and languages are all tools, and those tools being supported is important. Some tools only need a very small team providing support to ensure success, but languages need a far larger team.
If a company such as Google decides to adopt a tool for a key project, then they can invest the resources themselves to see the project is supported, but very few teams are large enough to alone ensure a project will be supported, especially a project as significant as a language. If a project is open source, and if your team is large enough, perhaps your team should consider contributing to develop tools you use. But generally, most development teams are reliant on others also making that decision to contribute.
Actually, the backing of Google contributed significantly to Python being where it is today. Google even employed the BDFL for several years. And google is now a major backer of Kotlin. So a company can grow and back the tools they have been using, as with Python, or choose to back a project from the time they become involved, Kotlin.
For most teams, backing a language may be out of reach, but backing a smaller project based on the language can be an option. This is worth raising, because it is actually the smaller dependant tools and libraries that can be at risk of losing all support, at a significantly lower threshold than the language itself becoming unsupported.
A thriving community for a language means new up to date packages, libraries and support tools. If we want state of the art packages, libraries and support tools, we need the language to be seen not just as heavily used in existing projects, but more importantly a language of choice for new projects.
This means popularity growth is far more important than popularity. Today (2018) python is generally regarded as in absolute terms, the fastest growing programming language. Kotlin is in relative terms the fastest growing. When I chose python for projects back in 2004, it was seen as risk by team members, but the indicators were there that the language would not remain a risk. These are the signs that we need to read correctly with respect to not just programming languages, but tools, frameworks and libraries as well.
Methods, Traps and Metric Reliability.
No only are different ranking systems measuring different things, but they also measure those different things with differing accuracy. Every measure is compromised, and problems are discussed together with each measure. However, despite factors giving more prominence to one language over another with a given measure, if the difference is large enough, then these is still a difference after allowing for inaccuracy. Further, while there are reasons one language may perform artificially well or poorly compared to another with a given index, the trend any given language maybe useful even if the comparison with other languages is questionable.
Measure by Mention: Tiobe, Pypl
Distortions: Language name, difficulty to maintain and learn can all promote higher rankings.
These indexes work by looking for the frequency of web search terms, such as the language name in combination with other key words. Languages such as ‘go’ present a real challenge for these languages. Does a page titled “Go Python: Programming in Python”, reference both languages, given ‘go’ is in the title. If python is combined with programming then it does not mean a snake of a comedy act, but how often may another term such as ‘syntax’ be sufficient for a search? How about languages such as JavaScript with a long name and no need for extra terms as the word already restricts to programming. No Universal rule works in all cases. Still, these indexes are published every month, and Tiobe is the mostly widely known, but the most widely criticised for short term trends being highly erratic and a long term variance with other measures. Visual Basic more popular than JavaScript? Python still not top 3? PYPL is a newer ranking, and seems to reflect what languages are being written with now, whereas Tiobe seems to more reflect more on discussion to maintain applications, and as such may give more weight to languages with large code bases that are problematic to maintain, and less weight to languages (such as javascript) where programs are frequently replaced rather than maintained. As usual, the trends for any given language may be more important than the score overall. People search because there are problems!
Measure by Commit: github
Distortions: code bloat, language process
One example of such an index can be found on the blog by Ben Fredrickson. It should stand out that JavaScript is far more prominent by this measure, and other measures? One possible explanation is that there is a lot of JavaScript written by compilers. We have one repo, all written in kotlin, but compiling to JavaScript, and this is identified as being a JavaScript repo as there are more lines of JavaScript than kotlin, even though that JavaScript is simply a compiler translation of the JavaScript. That is no the only reason, as there are also JavaScript libraries in the repository. As JavaScript libraries are source code, it is impossible to tell if it is a library of code in that repository.
Apart from distortions such as those above, there is still very useful information.
That index avoids a trap of some others which simply count total lines of code, which will flatter very verbose languages with lots of boilerplate.
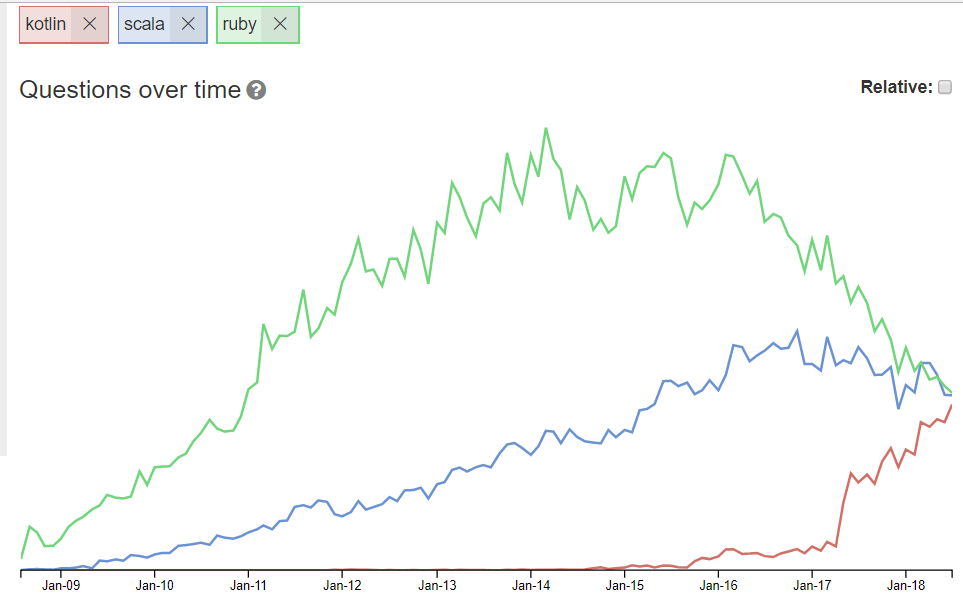
Measure by Questions: Stack overflow
 Distortions: Smaller teams may ask more on stackoverflow, difficult language = more question?
Got to stackoverflow/tags and you can get two figures for any language. The total questions asked ever, and the questions asked in the current period. For popular tags, the current period is just one week, there is a more useful ‘trends page‘ here. (there is also a version on stackoverflow itself, but that is not updated).
This index avoids many problems, and while there is still likely to be skew for characteristics of different languages, these skews a likely to be smaller than with any of the previous index types. This is a very useful way to follow trends.
Measure by Votes.
Distortion: Who answers surveys?
There is the possibility of independent developers visiting stackoverflow more often than those on teams with in-house gurus, and perhaps a particular type of person answers surveys and this also skews things, but generally this information should be the most accurate of all. The only negative is that the data collection is quite a process so there is typically only annual data to plot. On the plus side when you do get data, you get more, so getting separate data for what programmers do because they like it, from other data which may reflect what they do because their environment dictates. History suggests that what is liked is an indicator for what will in future be out there, but the future is always uncertain.
Conclusion.
A mixture of extracting trends, evaluating what is generally liked, and factoring where things are today seems to be the best way to have an idea what will still be available in the future.
As an example, the graph shown above indicates Kotlin, Ruby and Scala have currently very similar data, but the trend tells a different story.
